
James K. Sohn
2024-02-04 Sunday
Frontend
Using Your Console to its Full Potential
JavaScript
Debugging
Console
Any good JavaScript developer knows the console is our debugging partner. But there is more beyond 'console.log' that the console can offer us. Level up your debugging game with more console functions.
Intro
Debugging is an essential process of the development process. And debugging with the right tools is often crucial in improving your overall productivity. However, like most of the JavaScript developers out there, my go-to tool is the console. Of course, there are definitely times where I rely on the debugger, but I prefer to use them under more specific circumstances like when I want to have breakpoints in my program to inspect the state of my application. On the contrary, I rely on the console to confirm whether a piece of my code is properly executing or check how my asynchronously fetched data is structured. And that's something I rarely need the debugger for.
I truly believe that the console is a powerful tool. But it is often overlooked because much of its capabilities beyond console.log are hidden away from us. So here are some of the console functions that can help you make the debugging process less painful.
console.count()
As the name suggests, all console.count() does is log how many times it has been called.
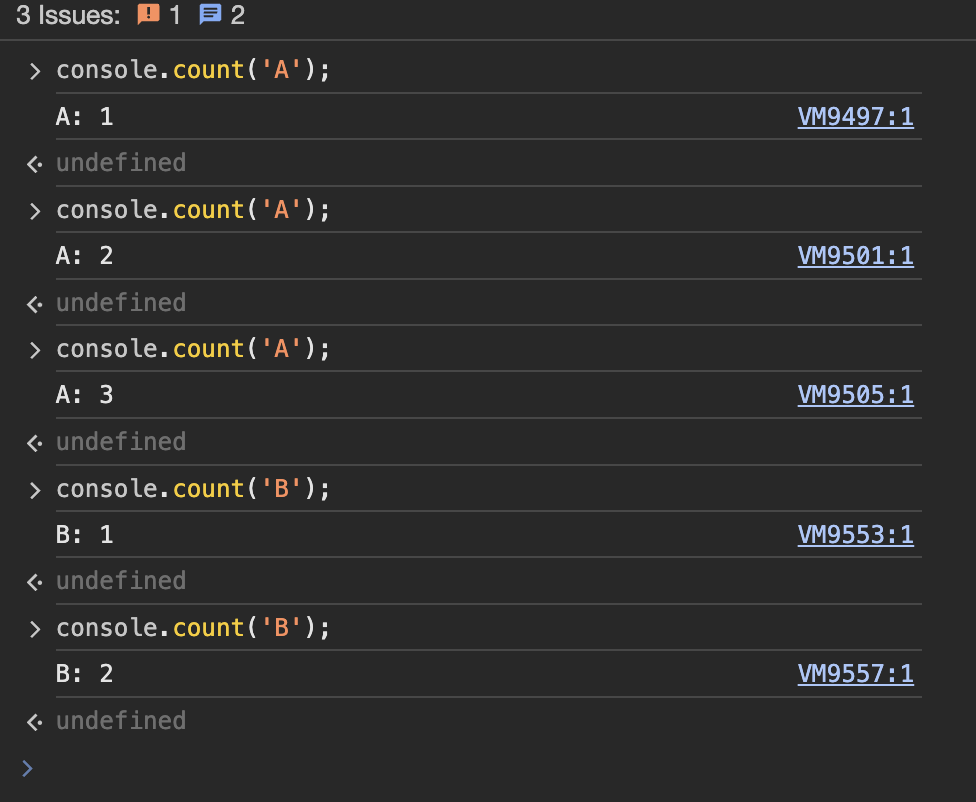
In the image above, "A" and "B" are labels. Counts are separately accumulated per label, therefore using multiple counts in your codebase is completely fine. Which means you can label and use console.count in your functions or components to easily see how many times your code renders unexpectedly.
function getSum(num1, num2) {
  console.count("getSum");
  return num1 + num2;
}

function TestComponent() {
  console.count("TestComponent");

  return (
    <div>
      <p>This is a test component</p>
    </div>
  );
}
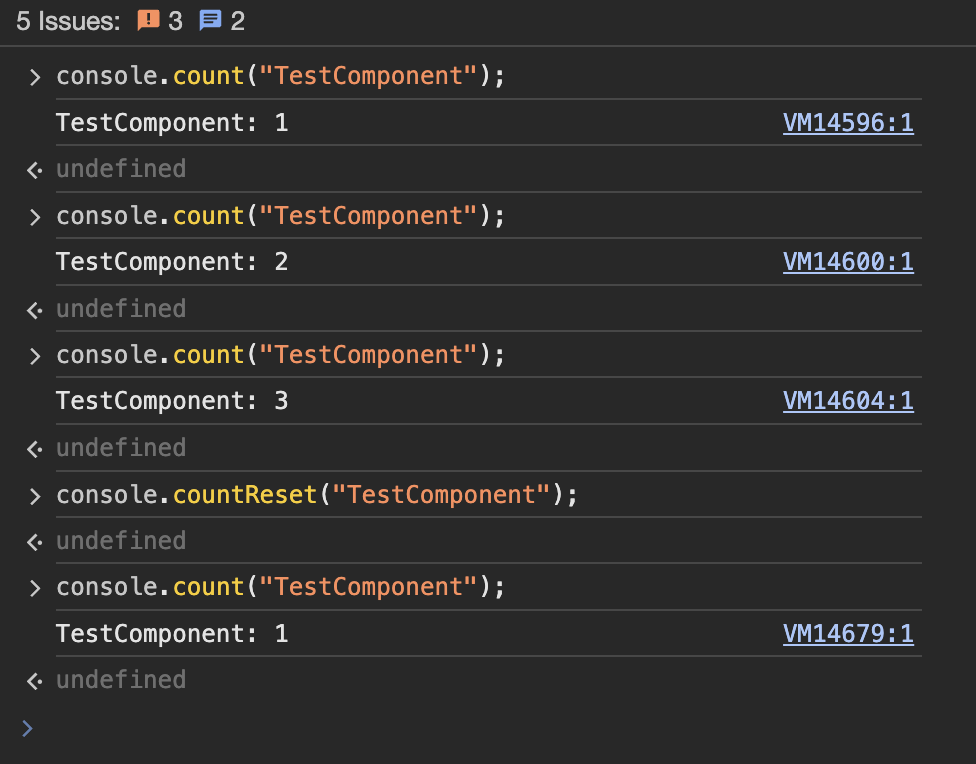
To reset a count, simply call console.countReset() with the correct label.
console.table()
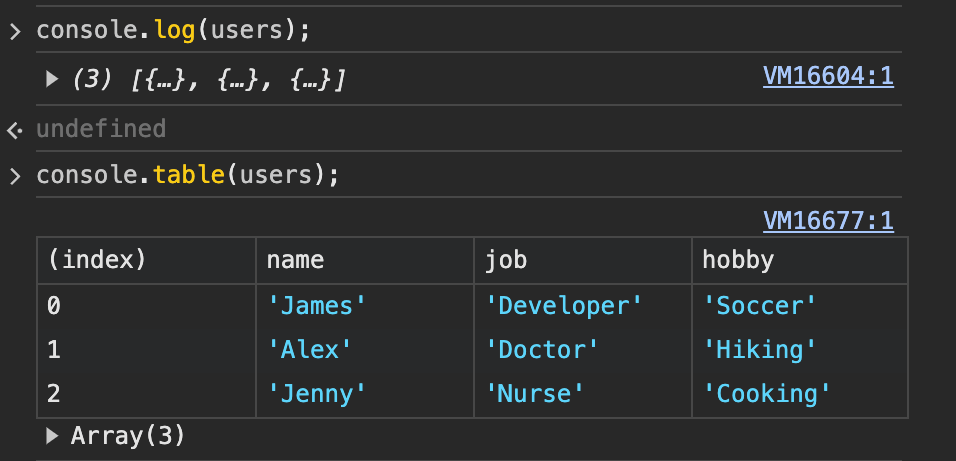
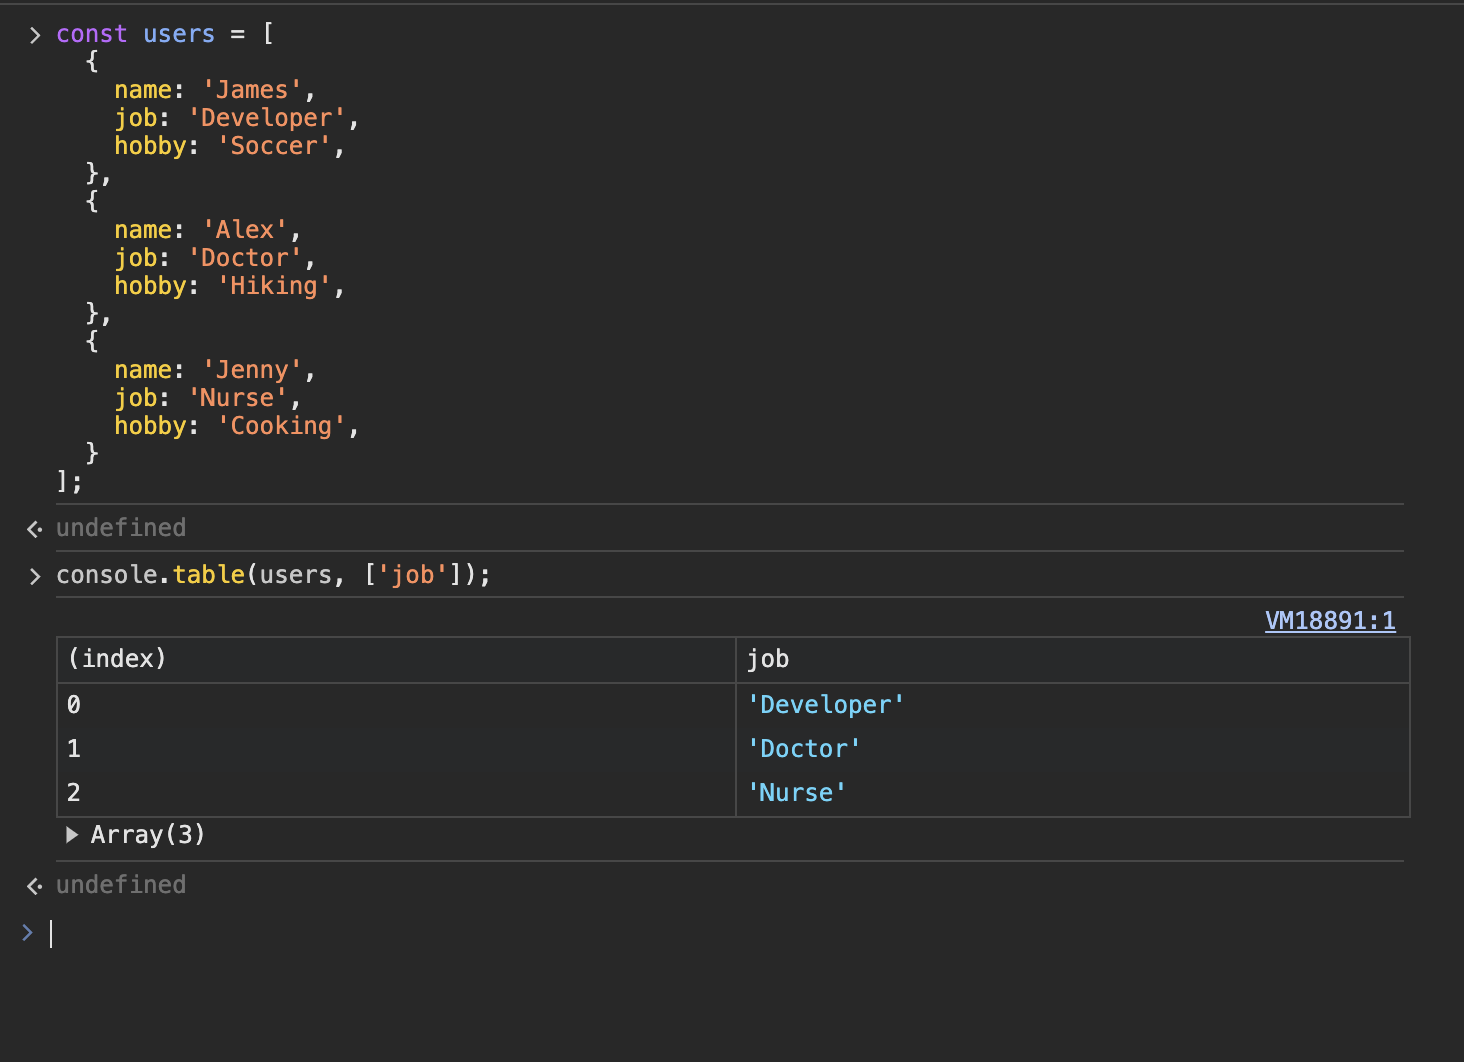
As frontend developers, we all know the pain of logging server fetched data on the console, having to open it up, and trying to visualize the structure of the object. console.table() takes away that pain from us by presenting the object in a visual table. (My absolute favorite)
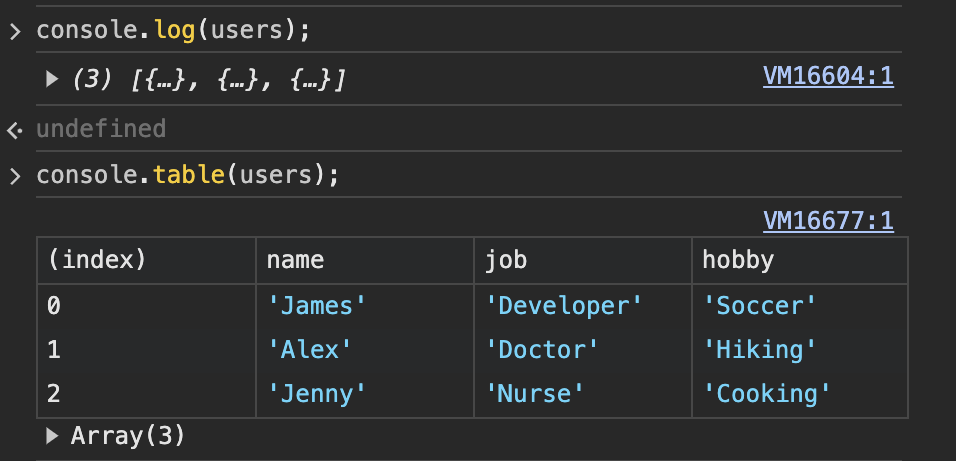
You can also explicitly define which columns you want to see by passing an array of target column names as the second param.
console.time()
console.time() is a console function dedicated to measuring the time it takes to handle certain JavaScript operations. It comes in a pair with console.timeEnd(), which you probably would have never guessed, ends the timer!
export default function someSlowOperation() {
  console.time();
  // ...something slow here
  console.timeEnd();
}
After console.timeEnd function has been called, the console will display how much the operation took in milliseconds. Similar to console.count, it takes a label that can be used to differentiate multiple console.time functions running in the same codebase.
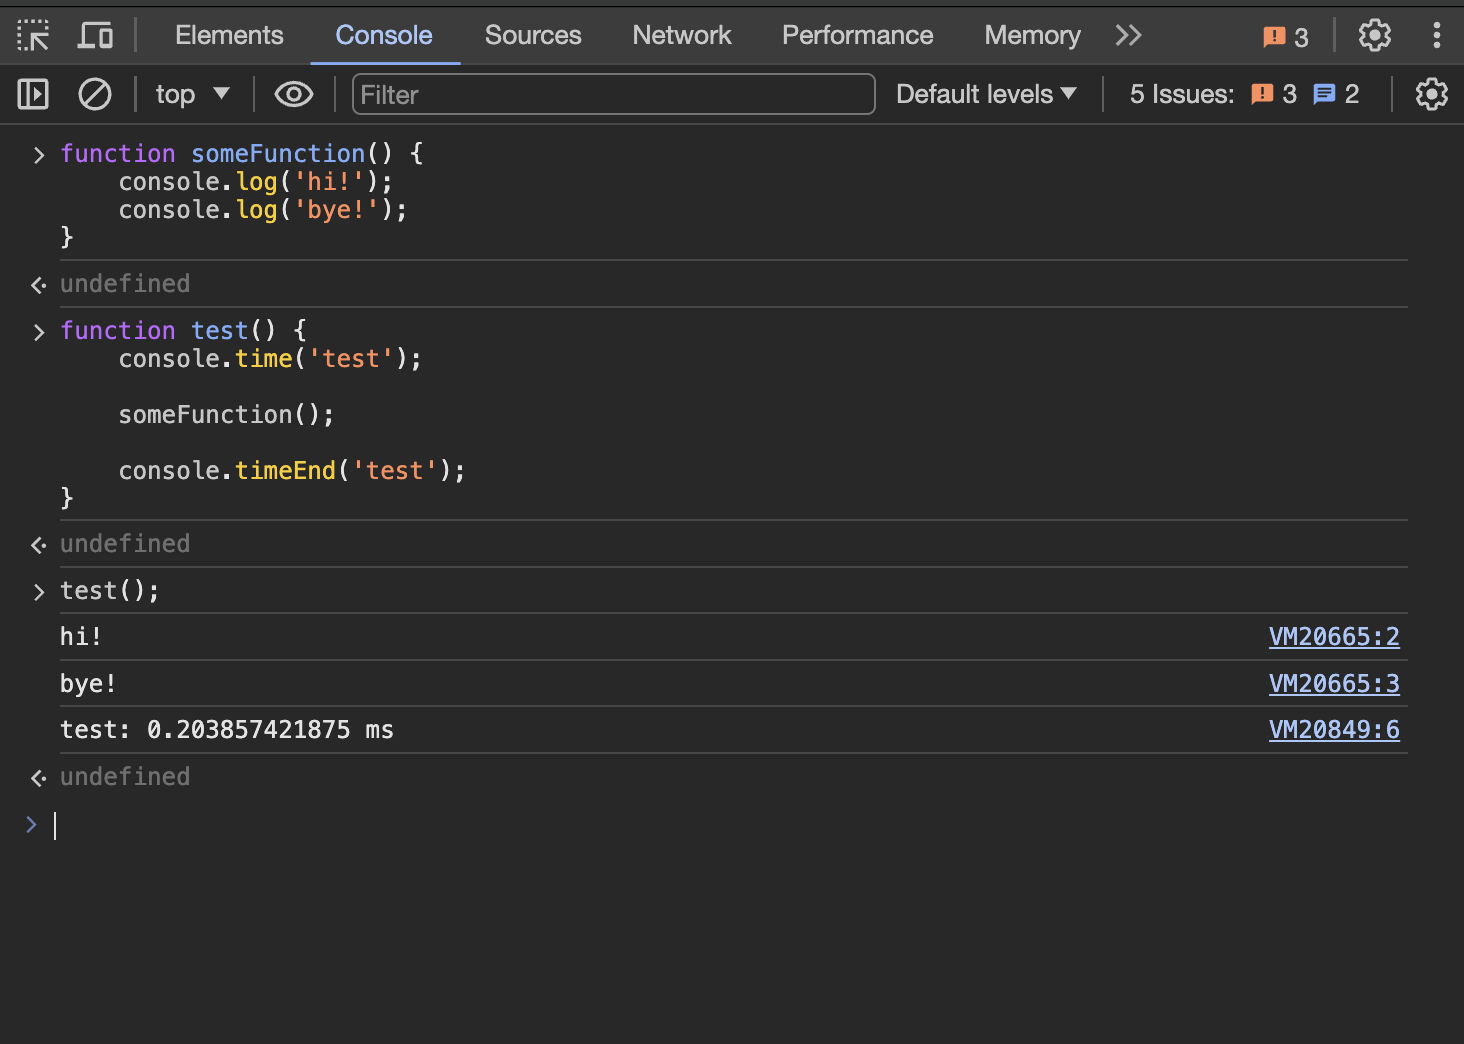
someFunction in the example above isn't a slow operation by any means, but you can probably understand how console.time works.
console.group()
I think we've all been at a stage in development where we are checking for so many things that the browser's console starts becoming bombarded with logs we no longer understand the origin of. In this case, console.group() is a highly helpful tool that nests logs into collapsible groups.
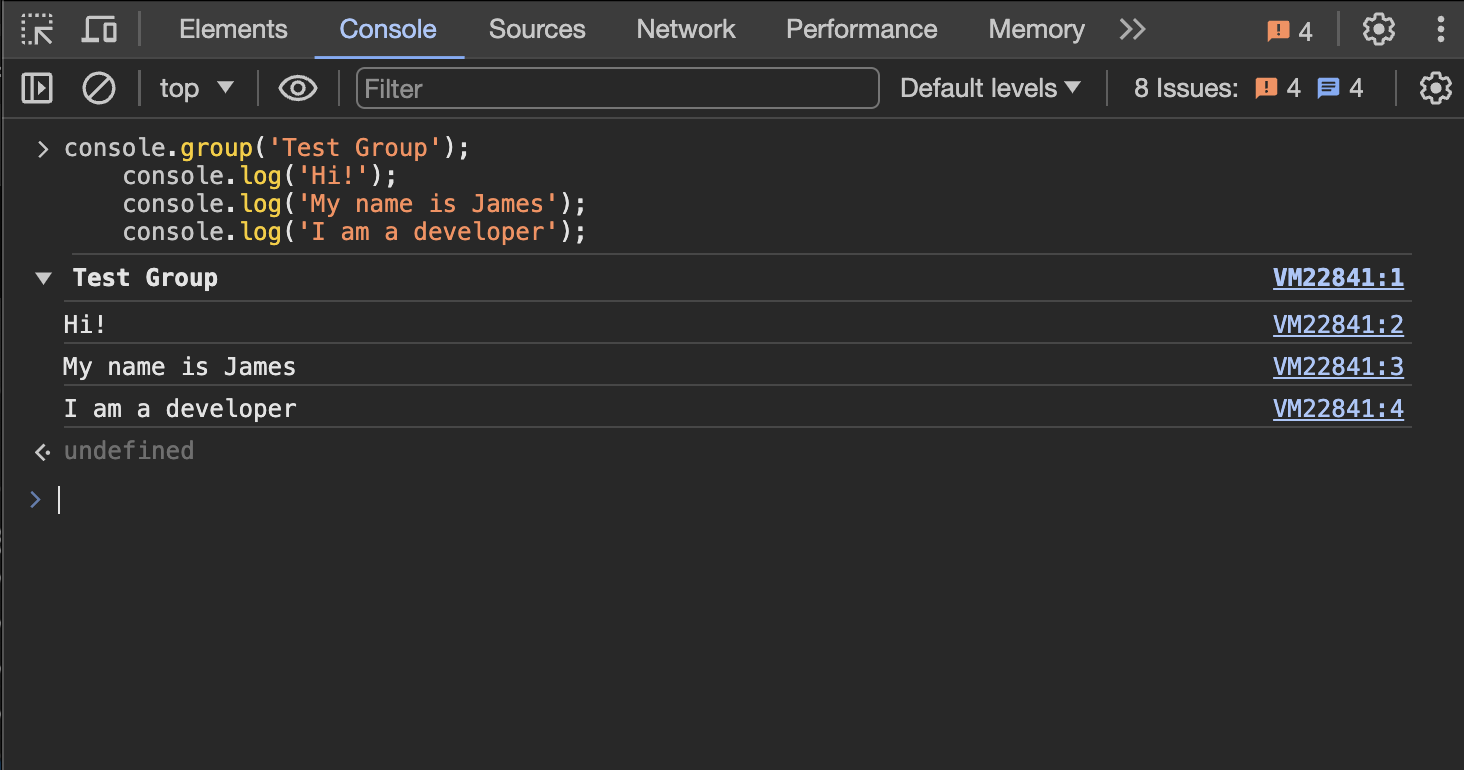
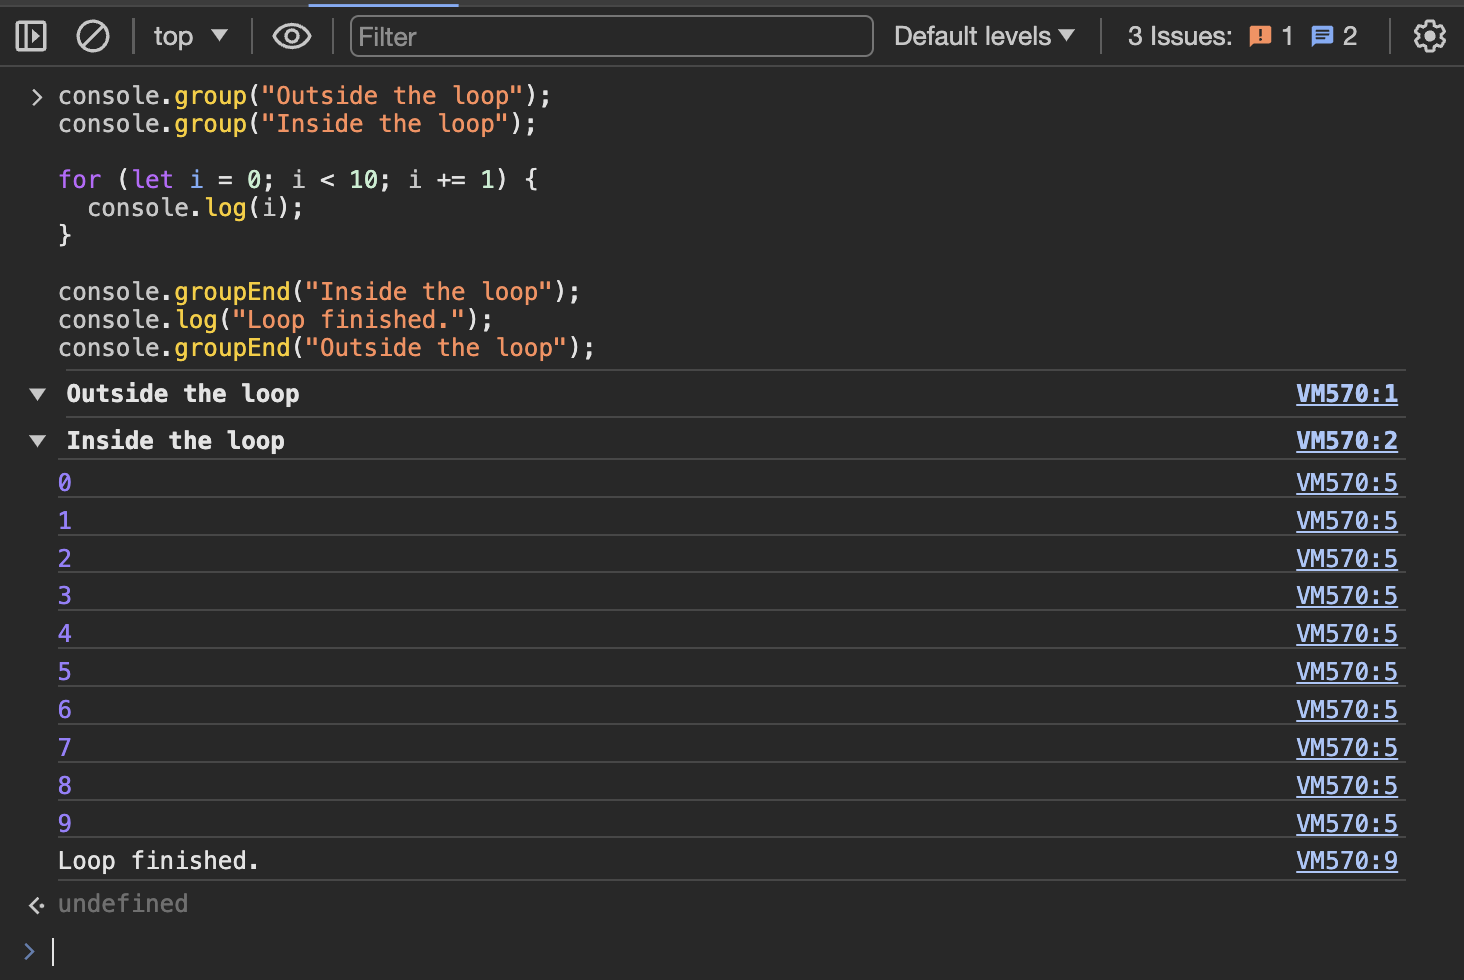
You can also nest groups inside other groups.
console.group("Outside the loop");
console.group("Inside the loop");

for (let i = 0; i < 10; i += 1) {
  console.log(i);
}

console.groupEnd("Inside the loop");
console.log("Loop finished.");
console.groupEnd("Outside the loop");
Conclusion
Prior to learning about all these console functions, I relied solely on console.log() to visualize how my code is working under the hood. But as any JavaScript developer knows, this could easily get overwhelming in scenarios where I am checking for so many things as I would forget which log represented what. Instead, getting familiar with the four introduced console functions helped me increase my productivity a lot more and made the debugging process much less painful.
No previous post in the category
Next
The Pros of Using Tailwind
